
The k-means algorithm is one of the methods of most commonly used clustering methods in machine learning, particularly because of its simplicity and efficiency.
It is a technique of unsupervised clustering which automatically classifies the data into groups or clusters with similar characteristics, where «k» represents the number of groups into which we wish to divide the data set.
The k-means clustering It is particularly useful for applications such as image segmentation, the image processing and the data grouping in various areas.
How does the K-Means algorithm work?
The k-means algorithm It follows an iterative procedure to cluster the data into k clusters. The main steps of the algorithm are:
- Initialisation: k points are selected at random from the data space; these will act as the initial centroids for each cluster.
- Cluster allocation: each data point is assigned to the cluster whose centroid is closest, by calculating the Euclidean distance.
- Centre-point repositioning: the cluster centroids are recalculated based on the points assigned in the previous step.
- Iteration until convergence: the clustering and reallocation steps are repeated until the cluster centres no longer change significantly or the number of iterations reaches a predetermined maximum.
How do you choose the value of k?
Determining the appropriate value for k is a crucial step in achieving effective results. Some useful methods for finding the optimal value of k are:
- The Elbow Method: this method plots the sum of squared errors (SSE) against k. The point where the graph shows an elbow-shaped curve indicates a suitable value for k.
- Silhouette Coefficient: it is a measure of the separation and cohesion of clusters, where high values indicate well-defined clusters.
- Cross-Validation: Cross-validation is used with a dataset to test various values of k and select the one that yields the best results.
K-Means in image processing and classification
K-means clustering has become a very powerful and widely used technique for image processing, particularly for tasks such as segmentation and colour reduction.
In these applications, pixel values are grouped into clusters to identify visual patterns. Some specific uses in this field include:
- Image segmentation: Pixels with similar characteristics (such as colour or texture) are grouped into clusters to distinguish different areas within an image. This is useful in medicine for identifying regions of interest in X-rays and MRI scans.
- Image compression: By grouping similar colours, k-means can reduce the number of colours in an image, thereby reducing its file size without any noticeable loss of visual quality.
Example of using the K-Means algorithm in Python
Python offers several libraries that simplify the implementation of k-means, especially scikit-learn, which features an optimised K-means function. A basic example of its implementation in Python would be as follows:
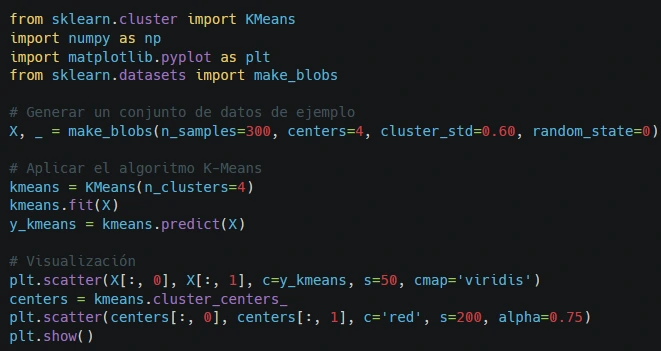
In this example, the K-Means algorithm is used to cluster artificially generated data points in a two-dimensional space. These points are distributed across four groups or clusters, forming a circular pattern with some dispersion. The aim is to automatically identify these four clusters in the data.
When should you use K-means clustering?
The k-means algorithm It is useful in situations where data needs to be segmented into homogeneous groups and there is a prior estimate of the approximate number of clusters.
Some typical applications are:
- Customer analysis: to group customers with similar preferences into behavioural clusters.
- Social media analysis: to identify communities on social media that share a certain connection.
- Image processing: for image segmentation and compression tasks, as we saw earlier.
- Bioinformatics: the grouping of genes or proteins according to patterns of gene expression.
Generalisation and limitations
The grouping k-means It is versatile, but its simplicity entails certain limitations. Its sensitivity to scale and its dependence on k can be disadvantages if it is not applied correctly.
Some variants of this algorithm, such as k-means++ or the hierarchical clustering, offer alternatives to improve accuracy and adaptability in specific situations.
K-means++, for example, selects the initial centroids more strategically, thereby reducing the likelihood of converging to sub-optimal solutions. Another variation is mini-batch k-means, which is particularly useful for working with large datasets, as it processes data in batches rather than using the entire dataset, thereby reducing processing time.
Examples of gentrification in cities
Clustering using k-means can be used to understand processes of gentrification in cities, a phenomenon whereby less developed areas experience social and economic improvement.
Using socio-economic variables (income, age, type of housing), it would be possible to to identify patterns of change in different areas of a city, grouping them into clusters that reflect areas undergoing gentrification, where gentrification is well established, or where there has been no significant change.
For an analysis of this kind, relevant variables are selected and standardised; the k-means algorithm is then applied to generate clusters and obtain information on the areas undergoing demographic or economic changes.
To illustrate a gentrification analysis using Python, we are going to create a dataset representing various areas of a fictional city. We will assume that each area has characteristics such as average income and average house price, which will allow us to see whether any areas undergoing gentrification can be identified.
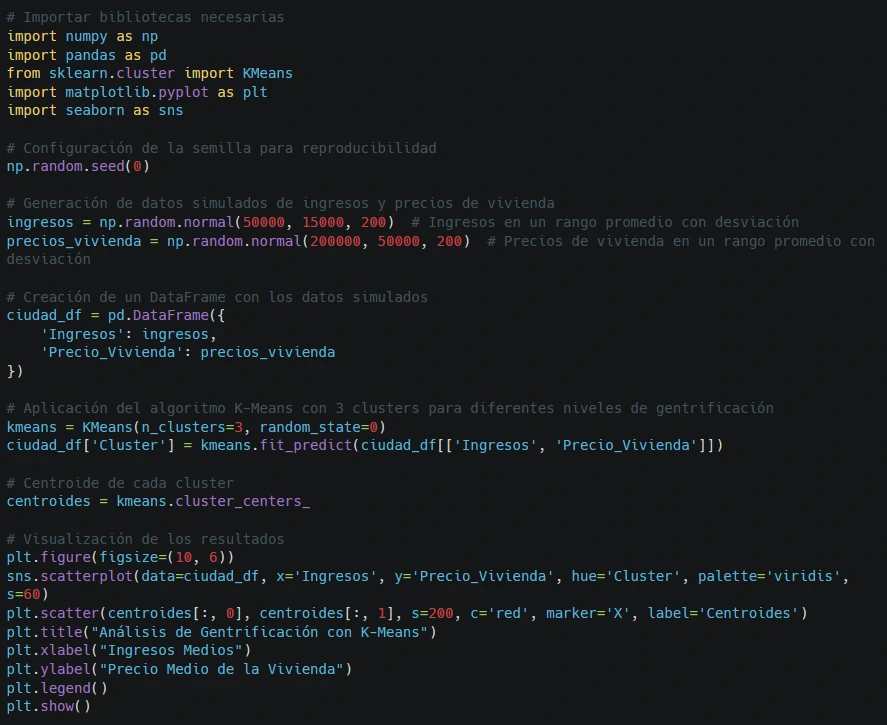
The code above shows a simulated K-Means analysis, which provides a visual way of identifying patterns that may be indicative of gentrification and which could be adapted to real-world data to assess trends in change across different areas of a city.
K-means, an excellent choice for unsupervised learning
It can therefore be seen that the k-means algorithm is a very useful tool in the field of machine learning to group or cluster data, and offers a wide range of applications, from image processing to understanding social patterns such as gentrification.
This algorithm has become one of the preferred techniques in unsupervised learning and it is recommended when you have a rough idea of the number of clusters you wish to create.
The key to using this algorithm effectively lies in choosing the right value for k and understanding the limitations of this method.
If you’d like to find out more about this or other algorithms used in artificial intelligence and machine learning, I recommend our Master’s Degree in Continuing Professional Development in Artificial Intelligence.



 Español
 English (UK)